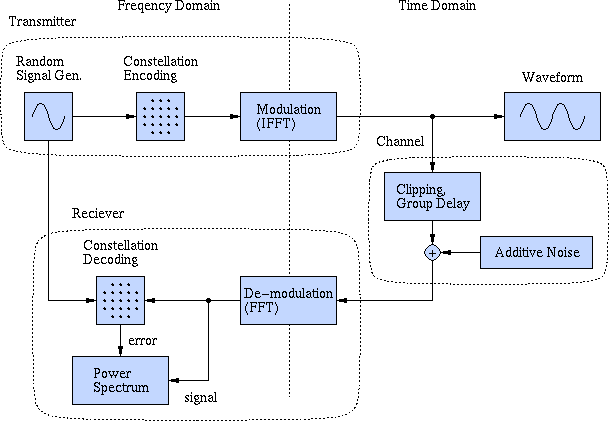
ADSL simulation applet
Description of the signal
- The waveform is composed on ANSI T1.413 (Discrete Multi Tone)
specifications with 256 tones.
- The bit allocation for each tone is 5 bits, thus each
constellation is 32 CR QAM.
- Sorry but no FEC, tone ordering nor cyclic prefix. It is a
simulation of modulation and demodulation of the DMT line code
written in Java.

Description of the applet
- Upper graph is a waveform of ADSL(DMT) in the time domain. Red line indicates clipping level, blue line indicates additive noise level.
- Lower left graph is a constellation after demodulation of the
waveform above.
- Lower right graph is a spectrum of signal power as well as error
power.
- Left slider is for altering the clipping level, center slider
is for noise level and right slider is for group delay.
- You can start simulation by clicking the graph with a left mouse
button. And if you want another appearance, try a right mouse button.
- If you have a center button on your mouse, you can see the decision
and throughput of the system.
- Sorry but this applet doesn't work if you copy it onto your site.

